
At the time when I wrote my previous post, October 2009, I only had 7 weeks of data (about the length of time the scheme had then been running). I was pleased to discover that it was possible to learn a bit about Dubliners' bike habits even with this limited quantity of data. Nevertheless, I wanted to return to the idea when I had a bigger data-set.
It has taken a while but I have finally collected over a year of data for the Dublin bikes scheme as well as almost a year of data for similar bike schemes (also run by J.C.Decaux) in Brussels, Lyon, Paris and Seville.
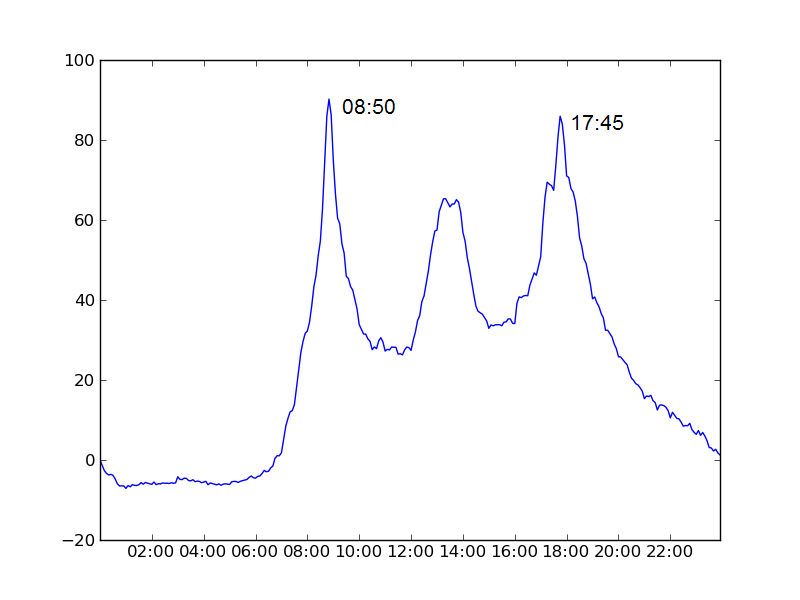
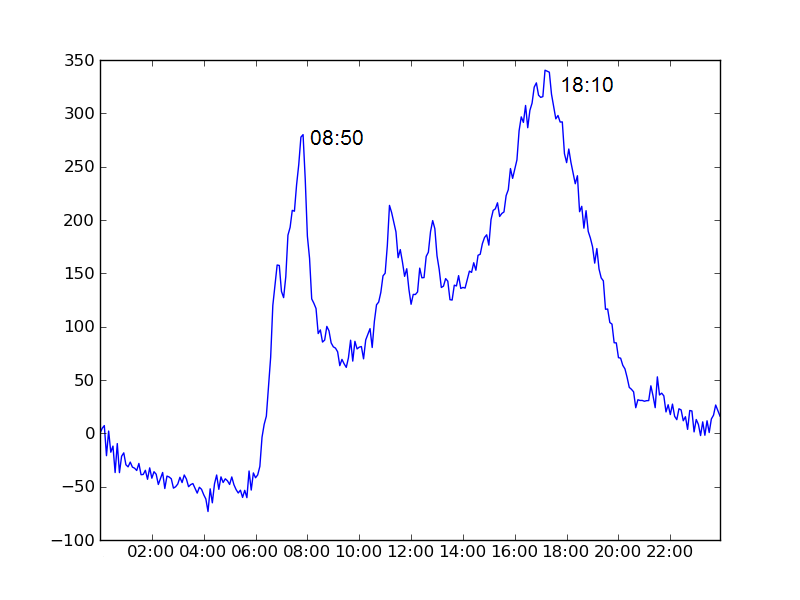
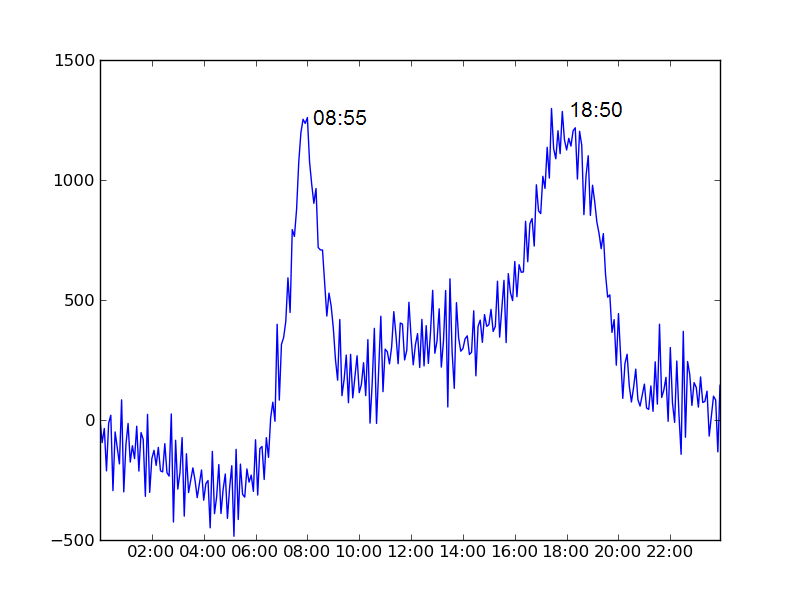
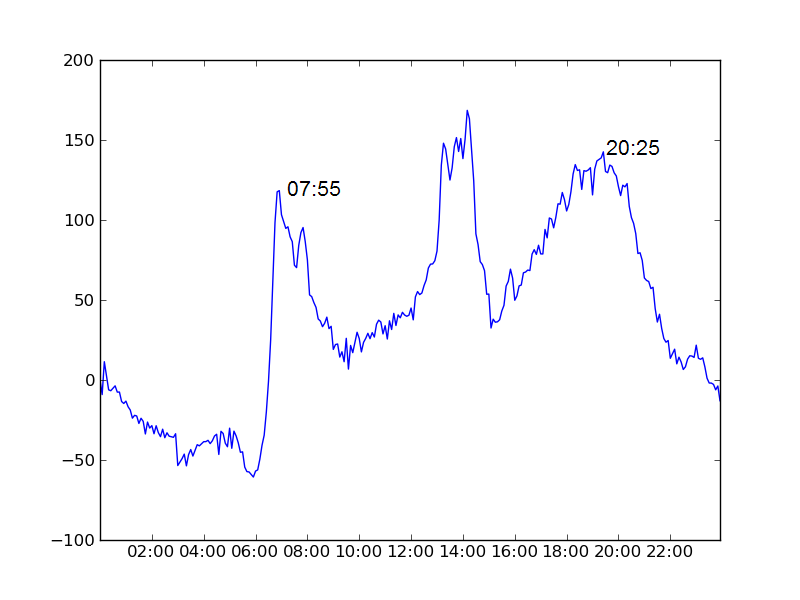
In the below charts we plot the average number of bikes in use as a function of time of day minus the number that were in use at midnight.

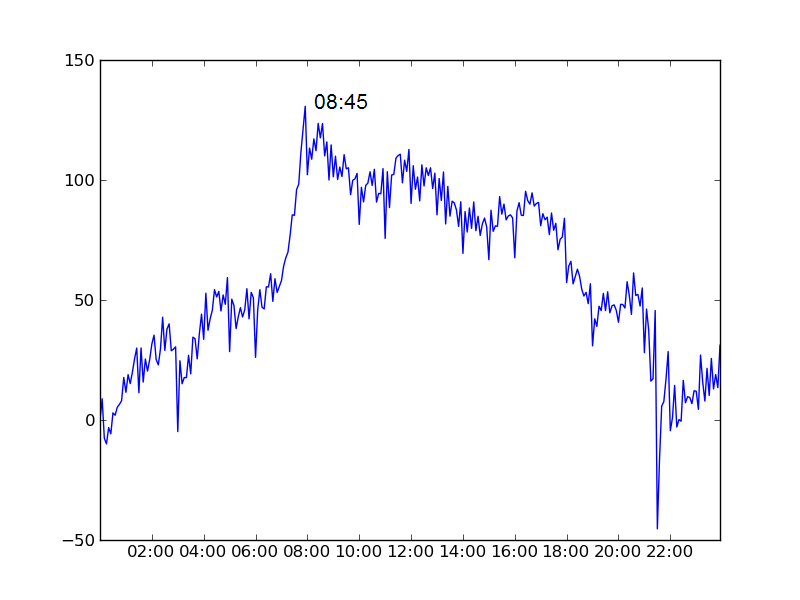
Brussels's physical geography leads to a rather inefficient allocation of the bikes as the day goes on (ie. stations at the top of hills are empty while those at the bottom are full), which can be a little frustrating.Furthermore he has set up an excellent website with useful data about the Brussels bike scheme with the intention of drawing attention to this important issue.
Returning to the original idea of comparing different European cities' apparent/implied working hours, let us gather our data in a table:
| City | Morning peak (local time) | Evening peak (local time) | Time between peaks | |
 | Brussels | 08:45 | None | N/A |
 | Dublin | 08:50 | 17:45 | 8 hrs 55 mins |
 | Lyon | 08:50 | 18:10 | 9 hrs 20 mins |
 | Paris | 08:55 | 18:50 | 9 hrs 55 mins |
 | Seville | 07:55 | 20:25 | 12 hrs 30 mins |
So what do we make of that!? Certainly the data makes no suggestion that our European counterparts are slacking off with a shorter working week. Indeed Dublin comes in bottom of the four cities. The peak times are much less well defined for the other cities than for Dublin (this is because there are far more bikes and stations) but even allowing for this, there is no way this data suggests we work any harder here in Dublin (indeed it is hard not to conclude the opposite!). Of course this is an extremely crude method and shouldn't really be taken very seriously for a whole host of reasons but I still thought it would be a fun to see what I might find.
Two other brief points here are
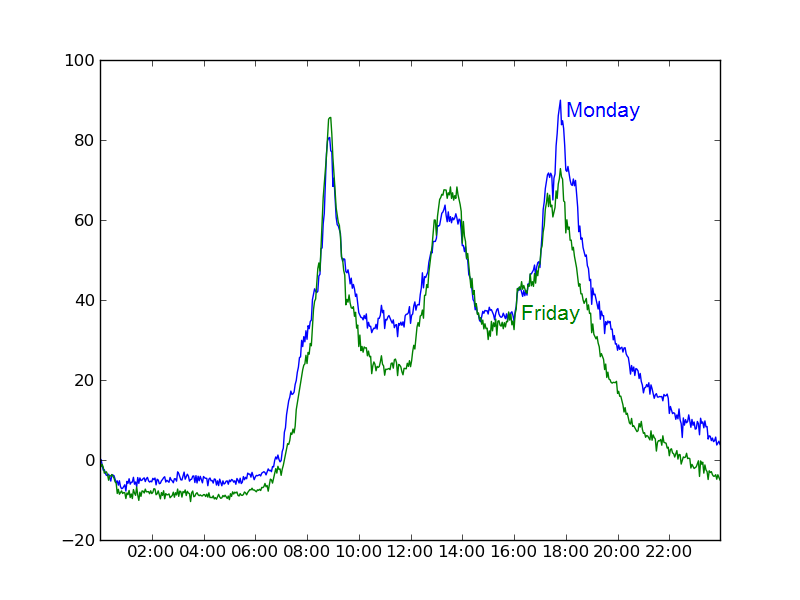
Regarding Summer vs. Winter, the situation is mildly interesting. The peaks in our usage by time-of-day graph occur at exactly the time and the usage peaks to the same value in the morning. However usage peaks at a significantly smaller value later in the day for Winter than for Summer. My guess is that people prefer using the bikes in Summer but not so much that they are willing to be late for work! (So morning usage is unaffected by the weather but not so for afternoon/evening.)

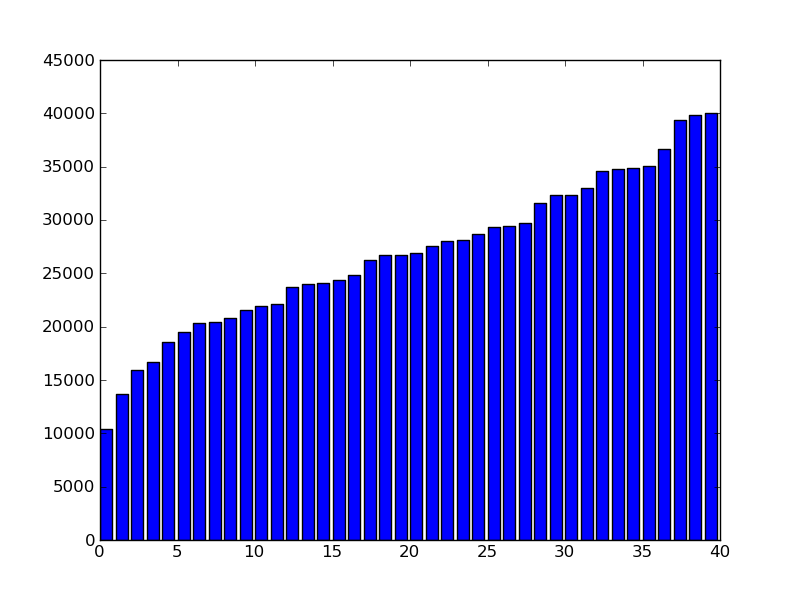
| Busyness rank | Station name | Busyness |
| 40 | Hardwicke street | 10436 |
| 39 | Parnell Square North | 13651 |
| 38 | Georges Quay | 15947 |
| 37 | Blessington Street | 16722 |
| 36 | Greek Street | 18594 |
| 35 | Fitzwilliam Square West | 19516 |
| 34 | Bolton Street | 20301 |
| 33 | Custom House | 20442 |
| 32 | Ormond Quay Upper | 20794 |
| 31 | Eccles Street | 21521 |
| 30 | Christchurch Place | 21957 |
| 29 | St. Stephen's Green East | 22104 |
| 28 | Golden Lane | 23741 |
| 27 | Leinster Street South | 23997 |
| 26 | Merrion Square West | 24129 |
| 25 | Dame Street | 24400 |
| 24 | Cathal Brugha Street | 24824 |
| 23 | Parnell Street | 26293 |
| 22 | Mountjoy Square West | 26692 |
| 21 | Jervis Street | 26733 |
| 20 | James Street East | 26879 |
| 19 | Molesworth Street | 27536 |
| 18 | Earlsfort Terrace | 28074 |
| 17 | High Street | 28082 |
| 16 | Townsend Street | 28662 |
| 15 | Merrion Square East | 29301 |
| 14 | St. Stephen's Green South | 29408 |
| 13 | Fownes Street Upper | 29743 |
| 12 | Talbot Street | 31604 |
| 11 | Wilton Terrace | 32323 |
| 10 | Portobello Harbour | 32326 |
| 9 | Charlemont Street | 32999 |
| 8 | Exchequer Street | 34557 |
| 7 | Princes Street / O'Connell Street | 34765 |
| 6 | Smithfield | 34829 |
| 5 | Grantham Street | 35034 |
| 4 | Chatham Street | 36681 |
| 3 | Herbert Place | 39368 |
| 2 | Pearse Street | 39857 |
| 1 | Custom House Quay | 40035 |
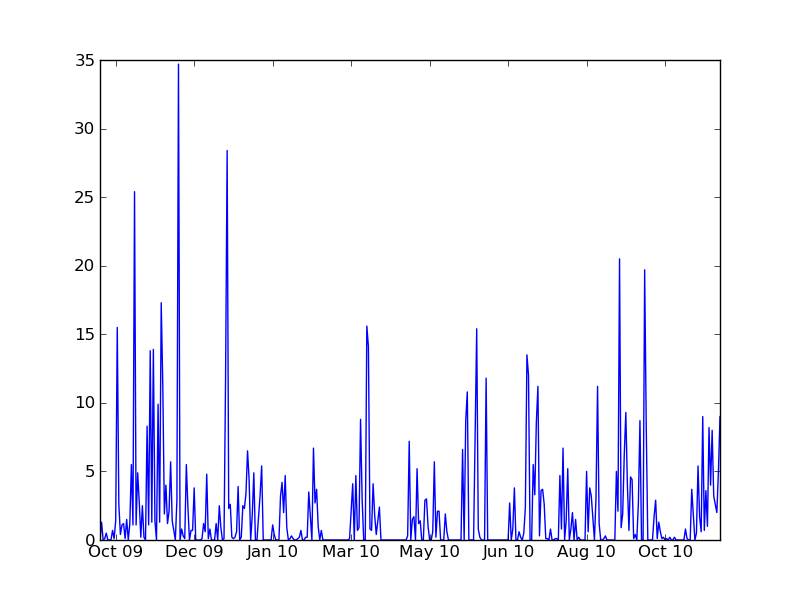
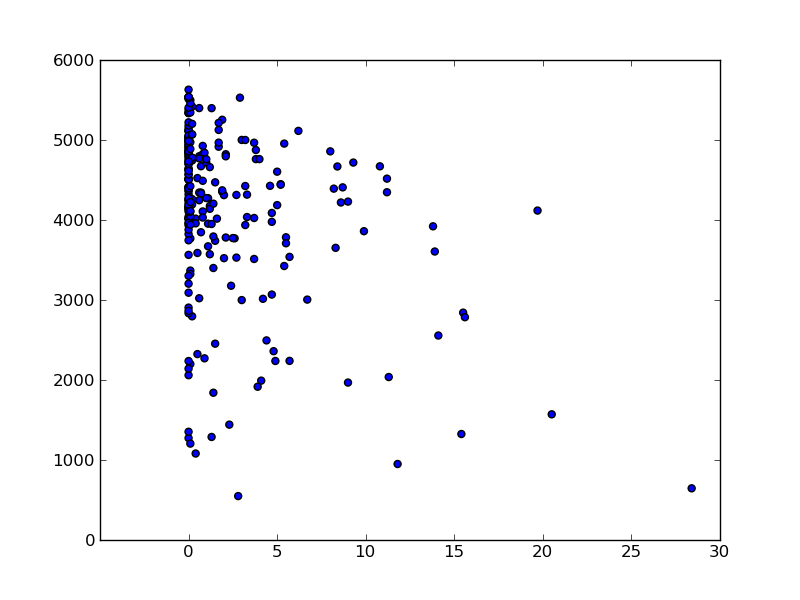
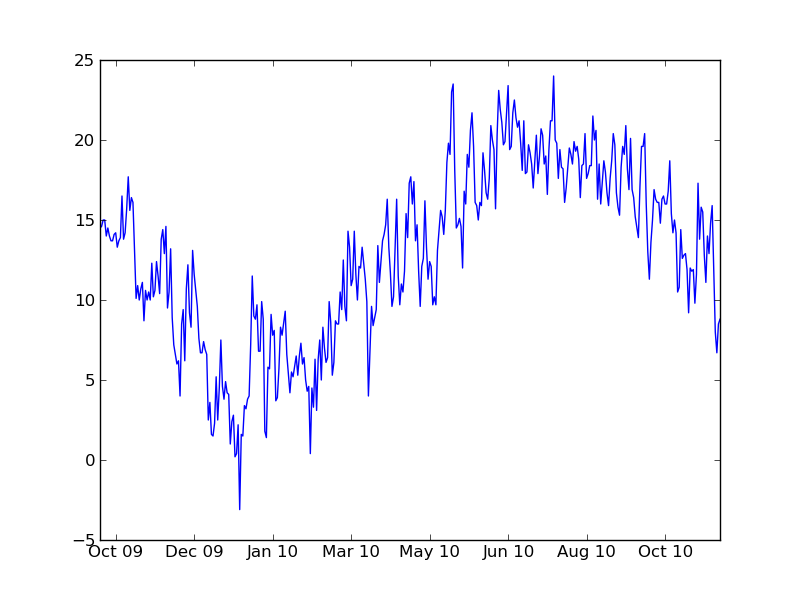
At first I expected the rainfall data to have the strongest predictive power, however this turned out not to be the case. Thinking about it, I should not have been surprised. Firstly, I only have one point in the scatter plot per day and only just over a year of data, so only about 400 data-points. While it might seem surprising to those of us who live in Dublin, it did not actually rain at all on the vast majority of days so most of the data-set is wasted on dry days. Secondly, while I believe rain is a very strong disincentive for people to cycle it usually only rains for relatively brief periods so we would probably need rainfall data on an much finer timescale like every 5 or 10 minutes to see the effect clearly. Finally, we have rainfall data for Dublin Airport, not Dublin City Centre. In any case, below are the charts.

Although I like the Dublin bike scheme, I can't help wondering if it is good value for money. It may well be, but I can't help wondering. It seems to me that there is a potential conflict of interest for the city councilors who make the decisions (the scheme is popular so they could be biased in favour of it, even at a bad price) or at least that the best decisions may not be made because of a possible asymmetric perception of opportunity cost relative to upfront cost by either the councilors of the public. A significant part of the payment for the scheme is in advertising revenue forgone by providing J.C.Decaux with free hoardings throughout the city. I would be interested to see the pricing detail. I have been told by those in the know that the keyword when buying such advertising space is the rate card and it seems that this website has some figures for that. I have not quite found the time to look into this in detail myself but would be interested to hear others' thoughts. I'm sure that a few FOI requests could turn up some interesting figures.
For my own part, I feel like I have spent more than enough time analysing bike schemes for now (indeed I had to force myself to write this post). However Dublin Bus are still promising that they will be providing GPS data on the location of their buses any day (they missed their own 2010 deadline). They claim to have a pilot scheme running on the 123 route and I did manage to find one stop with a so called real time passenger information (RTPI) display display on this route, but the display was blank. However in the last few weeks I have noticed the posts for several such displays appearing beside stops on Nassau Street so I expect this data may be on the way. I look forward to gathering and analysing it to see if I can detect any correlation between timetables and the movement of the buses.
  import urllib, time, csv, sys, datetime, gzip
  from xml.dom import minidom

  URL_station_list = 'https://abo-%s.cyclocity.fr/service/carto'
  URL_data = 'https://abo-%s.cyclocity.fr/service/stationdetails/%d'

  def prev_day_s(d_s):
     d = datetime.date(int(d_s[:4]), int(d_s[4:6]), int(d_s[6:8]))
     d -= datetime.timedelta(days=1)
     return '%04d%02d%02d' % (d.year, d.month, d.day)

  def yyyymmdd_from_epoch(t):
     tm = time.localtime(t)
     return '%04d%02d%02d' % (tm.tm_year, tm.tm_mon, tm.tm_mday)

  def get_stations(city, date, get_file = True):
     fname = '%s/%s.stations.xml' % (city, date)
     if get_file:
        urllib.urlretrieve(URL_station_list % city, fname)
     stations = map(lambda x: int(x.getAttribute('number')), minidom.parse(fname).getElementsByTagName('marker'))
     assert len(stations) > 0 # Horrible hack to quickfix case when web serves up incorrect stations data.
     return sorted(stations)

  if len(sys.argv) != 5:
     sys.stderr.write('Usage: python %s <city> <run time> <main loop delay> <request delay>\n' % sys.argv[0])
     sys.exit(1)

  city = sys.argv[1]
  (run_time, main_delay, req_delay) = map(float, sys.argv[2:])

  start_epoch = time.time()
  date = yyyymmdd_from_epoch(start_epoch)
  try:
     stations = get_stations(city, date)
  except:
     stations = get_stations(city, prev_day_s(date), False)

  out = csv.writer(gzip.open('%s/%s.out.csv.gz' % (city, date), 'a'))
  err = csv.writer(gzip.open('%s/%s.err.csv.gz' % (city, date), 'a'))
  t = time.time()
  while t < start_epoch + run_time:
     for i in stations:
        t = time.time()
        try:
           out.writerow([i, t] + map(str.strip, urllib.urlopen(URL_data % (city, i))))
        except:
           err.writerow([i, t, sys.exc_info()[0], sys.exc_info()[1]])
        time.sleep(req_delay)
     time.sleep(main_delay)
I also thought it would be worth recording the summary statistics for my various data-sets. So here are a few that seem relevant:
| City | Start date | End date | Number of records | Link to data |
| Brussels | 7-Dec-2009 | 8-Nov-2010 | 33,741,610 | 121 MB |
| Dublin | 19-Sep-2009 | 8-Nov-2010 | 30,909,771 | 104 MB |
| Lyon | 7-Dec-2009 | 8-Nov-2010 | 34,236,139 | 147 MB |
| Seville | 7-Dec-2009 | 8-Nov-2010 | 33,365,277 | 124 MB |
| Paris | 7-Dec-2009 | 8-Nov-2010 | 40,232,297 | 189 MB |
A record consists of a snapshot of a station and as such consists of a station ID, a date/time-stamp and a number which is the number of bikes docked at that station at that date/time. (It would be extremely interesting to get hold of J.C.Decaux's data in which they can actually track individual bikes.)
Also, in case it is useful to somebody, here is the weather data page on Met Eireann and the data which I have weather.csv.